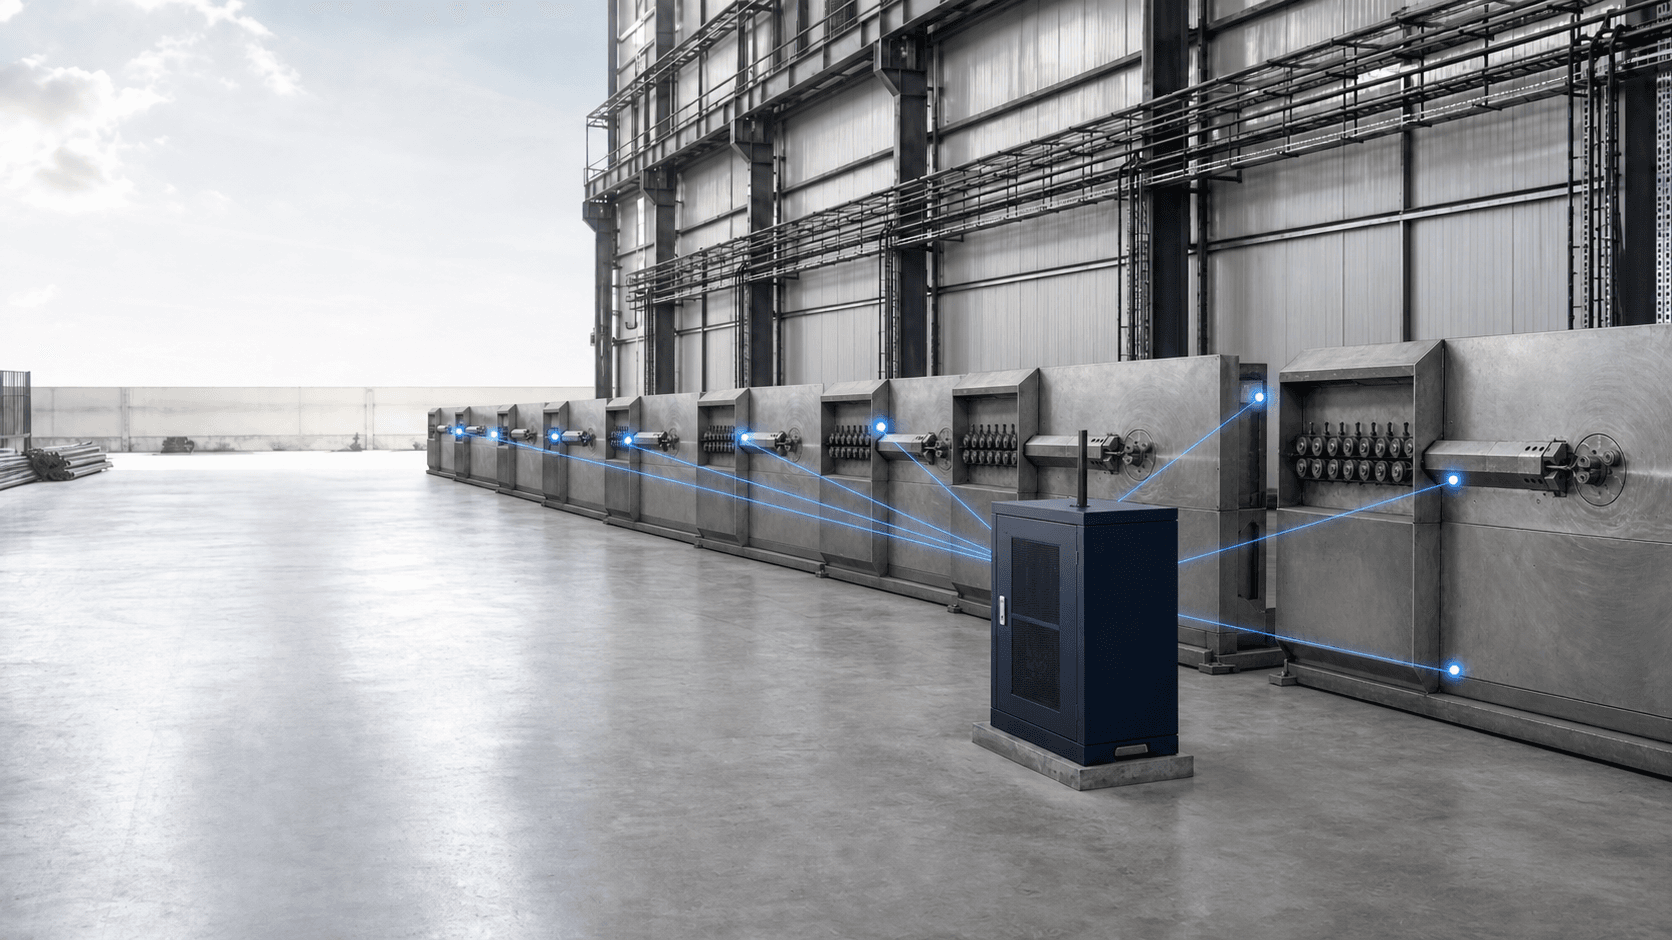
You cannot fix what you cannot see. EdgeIoTOne brings every connected bending machine and ring collector onto one screen, so you can see what is running, what has stopped and why. The server sits inside your own plant rather than on the internet, and it scales one sensor kit at a time as you add machines.
What EdgeIoTOne makes visible
An on-site view of connected bending machines and ring collectors, combining machine signals with time, energy and fault history. Start with one machine and extend the sensor kits as the plant grows.
01
Where the hours go
Review running, idle and stopped time per machine, live or over a selected shift and historical period. Use the same record for shift reporting and recurring-loss analysis.
02
Energy at the machine
A three-phase meter reads electrical values and energy use for each connected machine. Compare its consumption with output instead of allocating the whole-plant electricity bill by estimate.
03
Servo status and fault codes
Bring pulling and bending drive status into the dashboard. When an available drive interface reports a fault, show its code so maintenance can investigate without first visiting every panel.
04
Position and air-pressure signals
Monitor bending-pin position, centre-unit position and air pressure where those signals are available. Compare pressure against a configured threshold.
05
Alerts with event history
Route configured fault or stop events to the responsible team and retain an event log. Email delivery uses the agreed site mail and network configuration.
06
A dashboard on your network
Authorised users open the dashboard in a browser on the plant network, from a desktop, tablet or phone. The local monitoring application does not require a cloud service.
How it works
From a machine signal to an informed response
STEP 01
Measure
Fit a signal-reading PLC, power meter and pressure sensor as required by the machine.
STEP 02
Connect
Bring machine data onto the agreed plant network.
STEP 03
Read
View current state and history on the on-site server dashboard.
STEP 04
Act
Use fault details, trends and configured alerts to direct the response.
Technical overview
At each machine
- Signal collection
- Small PLC
- Power measurement
- Three-phase meter
- Air measurement
- Pressure sensor
- Motor signals
- Pulling and bending drive status
- Events
- Fault codes and configured alerts
Across the plant
- Server
- One industrial computer in a cabinet
- Network
- Existing plant network, subject to assessment
- Software
- Runs on site
- Dashboard
- Modern browser with authorised access
- Expansion
- Additional sensor kits for additional machines
One plant platform, added machine by machine
Aseiro supplies the agreed hardware, software, wiring and fitting, and trains the team to use the system. Define the first machines, available signals, reporting needs, network access and alert recipients before rollout. Local dashboard operation and delivery of email notifications are separate network requirements.
Discuss your application